IBM Cloud Code Engine is a fully managed, serverless platform that runs your containerized workloads, including web apps, micro-services, event-driven functions, or batch jobs. Code Engine even builds container images for you from your source code. Because these workloads are all hosted within the same Kubernetes infrastructure, all of them can seamlessly work together. The Code Engine experience is designed so that you can focus on writing code and not on the infrastructure that is needed to host it.
I am a big fan of Kubernetes, it is a very powerful tool to manage containerized applications. But if you only want to run a small application without exactly knowing how much traffic it will generate then Kubernetes may be too big, too expensive, and too much effort. A serverless platform would most likely be better suited for this, for example Knative Serving. But it still requires Kubernetes. If you run a Knative instance on your own you probably don’t gain much. This is where something like IBM’s Code Engine comes to play: They run the (multi-tenant) environment, you use a little part of it and in the end pay only what you use. You don’t pay for any idle infrastructure. Code Engine is currently available as a Beta.
Code Engine offers 3 different options: Applications, Jobs, and Container Builds. Applications and jobs are organized in “Projects” which are based on Kubernetes namespaces and act as a kind of folder. Apps and jobs within each folder can communicate over a private network with each other.
Run your code as an application
This is based on Knative Serving. A container image is deployed, it runs and accepts requests until it is terminated by the operator. An example would be a web application that users interact with or a microservice that receives requests from a user or from other microservices. Since it is based on Knative serving it allows scale-to-zero; no resources are used and hence no money is spent when nobody uses the service. If it receives a request, it spins up, serves the request, and goes dormant again after a time-out. If you allow for auto scaling, it spins up more instances if a huge number of requests come in. Knative Serving itself can do this but IBM’s Code Engine offers a nice web-based GUI for this. And some additional features that I describe later.
Run a job
What is the difference between an app and a job? An app runs until it is terminated by an operator, and it can receive requests. A job doesn’t receive requests and it runs to completion, i.e. it runs until the task it has been started for is complete. This is not Knative Serving but Kubernetes knows jobs and in the linked document is an example that computes π to 2000 places and prints it out. Which is a typical example for a job.
This is how the job would look in Code Engine:
There is a Job Configuration, it specifies the container image (perl) and in the Pi example the command (perl) and the 3 arguments to compute π to 2000 places and print it.
Submitting a “jobrun” creates a pod and in the pod’s log we will find π as:
This is where a Code Engine job differs from Kubernetes: In this screenshot, Array indices of “1-50” means that Code Engine will start 50 jobs numbered 1 through 50 using the same configuration. It doesn’t really make sense to calculate the number Pi 50 fifty times. (It should render the identical result 50 times, if not, something is seriously wrong.) But imagine a scenario like this: You have a huge sample of sensor data (or images, or voice samples, etc.) that you need to process to create a ML model. Instead of starting one huge job to process all, you could start 50 or 100 or even more smaller jobs that work on subsets of the data in an “embarrassingly parallel” approach. The current limit is a maximum of 1000 job instances at the same time.
Each of the pods for one of these jobs in an array gets an environment variable JOB_INDEX injected. You could then create an algorithm where each job is able to determine which subset of data to work on based on the index number. If one of the jobs fails, e.g. JOB_INDEX=17, you could restart a single job with just this single Array index instead of rerunning all of them.
Build a Container Image
Code Engine can build container images for you. There are 2 “build strategies”: Buildpack and Dockerfile:
Buildpack (or “Cloud Native Buildpack”) is something you may know from Cloud Foundry or Heroku: the Buildpack inspects your code in a source repository, determines the language environment, and then creates a container image. This is of course limited to the supported languages and language enviroments, and it is based on a number of assumptions. So it will not always work but if it does it relieves developers from writing and maintaining Dockerfiles. The Buildpack strategy is based on Paketo, which is a Cloud Foundry project. Paketo in turn is based on Cloud Native Buildpacks which are maintained under Buildpacks.io and are a Cloud Native Computing Foundation (CNCF) sandbox project at the moment. Buildpacks are currently available for Go, Java, Node.js, PHP, and .NET Core. More will probably follow.
The Dockerfile strategy is straightforward: Specify your source repository and the name of the Dockerfile within, then start to create. It is based on Kaniko and builds the container image inside a container in the Kubernetes cluster. The Dockerfile strategy should always work, even when using Buildpack fails.
The container images are stored in an image registry, this can be Docker Hub or the IBM Cloud Container Registry (ICR) or other registries, both public and private. You can safely store the credentials to access private image registries in Code Engine. These secrets can then be used to store images after being build or to retrieve images to deploy a Code Engine app or job.
Of course, you don’t have to build your container images in Code Engine. You can use your existing DevOps toolchains to create the images and store them in a repository and Code Engine can pick them up from there. But its nice that you can build them in a simple and easy way with Code Engine.
Code Engine CLI
There is a Code Engine plugin for the ibmcloud CLI. Currently the Code Engine (CE or ce) CLI has more functionality than the web based UI in the IBM Cloud dashboard. This will most likely change when Code Engine progresses during the Beta and when it becomes generally available later.
You can use the CLI to retrieve the Kubernetes API configuration used by Code Engine. Once this has been done you can also use kubectl and the kn CLI, you do have only limited permissions in the Kubernetes cluster, though. I have made a quick test: kubectl apply -f service.yaml does work, it creates an app in Code Engine. kn service list or kn service describe hello also work. You ar enot limited to the ibmcloud CLI, then.
Networking
Code Engine apps are assigned a URL in the form https://hello.abcdefgh-1234.us-south.codeengine.appdomain.cloud. They are accessible externally using HTTPS/TLS secured by a Let’s Encrypt certificate. If you deploy a workload with multiple services/apps, maybe only one of them needs to be accessed from the Internet, e.g. the backend-for-frontend. You can limit the networking of the other services to private Code Engine internal endpoints with the CLI:
$ ibmcloud ce application create --name myapp --image ibmcom/hello --cluster-local
This is the same you would do with a label in the YAML file of a Knative service.
Code Engine jobs do not need this, they cannot be accessed externally by definition. Jobs can still make external requests, though. And they can call Code Engine apps internally, there is an example in the Code Engine sample git repo at https://github.com/IBM/CodeEngine.
Integrate IBM Cloud services
If you know Cloud Foundry on the IBM Cloud this should be familiar. IBM Cloud services like Cloud Object Storage, Cloudant database, the Watson services, etc. can be “bound” to a Cloud Foundry app. When the Cloud Foundry app is started, an environment variable VCAP_SERVICES is injected into the pod that holds a JSON object with the configuration (URLs, credentials, etc.) of the bound service/s. The application starting in the pod can then retrieve the configuration and configure access to the service/s. The developers of Code Engine have duplicated this method and in addition to the JSON object in VCAP_SERVICES they also inject individual environment variables for a service (for code that struggles with JSON like Bash scripts).
The helloworld example displays the environment variables of the pod it is running in. If you bind a IBM Cloud service to it, you can display the results with it:
This binding of IBM Cloud services is really interesting for Code Engine jobs. Remember that you cannot connect to them and they can by themselves only write to the joblog. With this feature, you can bind for example a Cloud Object Storage (COS) service to the job, place your data into a COS bucket, run an array of jobs that pick “their” data based on their JOB_INDEX number, and when done, place the results back into the COS bucket.
You may have guessed that under the covers, binding an IBM Cloud service to a Code Engine app or job creates a Kubernetes secret automatically.
Conclusion
Keep in mind that at the time of this writing IBM Cloud Code Engine has just started Beta (it was announced last week). It still has beta limitations, some functions are only available in the CLI, not in the Web UI, and during the Beta, price plans are not available yet. But it is already very promising, it is a very easy start for your small apps using serverless technologies. I am sure that there will be more features and functions in Code Engine as it progresses towards general availability.
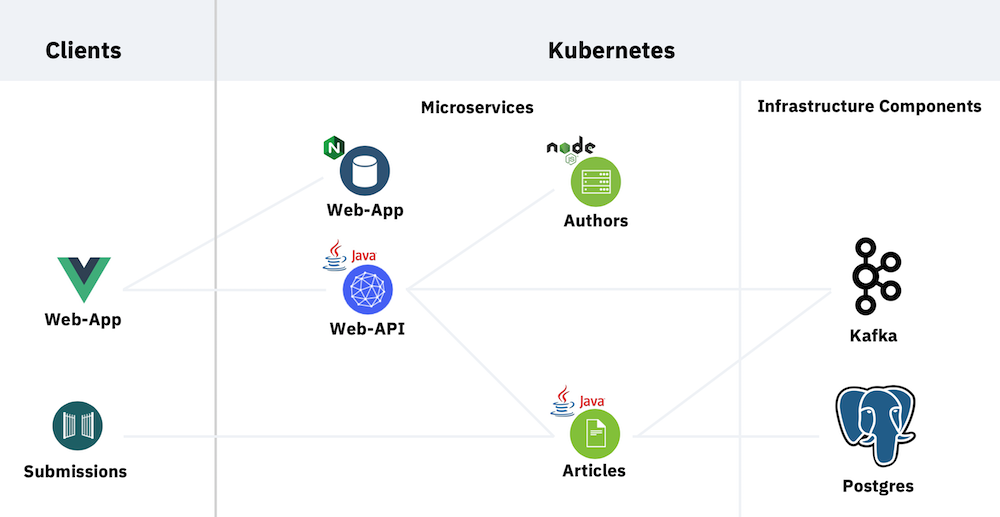
We have added an application security example to our pet project Cloud Native Starter.
Picture 1: Application Architecture
The functionality of our sample is this:
A Web-App service serves a Vue.js/Javascript Web-App frontend application running in the browser of a client
This frontend redirects the user to the login page of Keycloak, an open source identity and access management (IAM) system
After successful login, the frontend obtains a JSON Web Token (JWT) from Keycloak
It requests a list of blog articles from the Web-API using the JWT
The Web-API in turn requests the article information from the Articles service, again using the JWT
The Web-API and Articles services use Keycloak to verify the validity of the JWT and authorize the requests
My colleague Niklas Heidloff has blogged about the language specific application security aspects here:
Security in Quarkus Applications via Keycloak
Securing Vue.js Applications with Keycloak
We also created an app security workshop from it, the material is publicly available on Gitbook.
In this article I want to talk about application security from the platform side. This is what we cover in the above mentioned workshop:
Picture 2: Platform view of the Cloud Native Starter security sample
There are two things that I want to write about:
Accessing the application externally using TLS (HTTPS, green arrow)
Internal Istio Service Mesh security using mutual TLS (mTLS, red-brown arrows)
About the architecture
This is a sample setup for a workshop with the main objective to make it as complete as possible while also keeping it as simple as possible. That’s why there are some “short cuts”:
Istio installation is performed with the demo profile.
Istio Pod auto-injection is enabled on the default namespace using the required annotation.
Web-App deployment in the default namespace is part of the Istio service mesh although it doesn’t benefit a lot from it, there is no communication with other services in the mesh. But it allows us to use the Istio Ingress for TLS encrypted HTTPS access. In a production environment I would probably place Web-App outside the mesh, maybe even outside of Kubernetes, it is only a web server.
Keycloak is installed into the default namespace, too. It is an ‘ephemeral’ development install that consists only of a single pod without persistence. By placing it in the default namespace it can be accessed by the Web-App frontend in the browser through the Istio Ingress using TLS/HTTPS which is definitely a requirement for an IAM — you do not want your authentication information flowing unencrypted through the Internet!
Making it part of the Service Mesh itself automatically enables encryption in the communication with the Web-API and Articles services; both call Keycloak to verify the validity of the JWT token passed by the frontend.
In a production setup, Keycloak would likely be installed in its own namespace. You could either make this namespace part of the Istio service mesh, too. Or you could configure the Istio Egress to enable outgoing calls from the Web-API and Articles services to a Keycloak service outside the mesh. Or maybe you even have an existing Keycloak instance running somewhere else. Then you would also use the Istio Egress to get access to it.
We are using Keycloak in our workshop setup, it is open source and widely used. Actually any OpenID Connect (OIDC) compliant IAM service should work. Another good exampe would be the App ID service on IBM Cloud which has the advantage of being a managed service so you dan’t have to manage it.
Accessing the application with TLS
In this example we are using Istio to help secure our application. We will use the Istio Ingress to route external traffic from the Web-App frontend into the application inside the service mesh.
From a Kubernetes networking view, the Istio Ingress is a Kubernetes service of type LoadBalancer. It requires an external IP address to make it accessible from the Internet. And it will also need a DNS entry in order to be able to create a TLS certificate and to configure the Istio Ingress Gateway correctly.
How you do that is dependent on your Kubernetes implementation and your Cloud provider. In our example we use the IBM Cloud and the IBM Cloud Kubernetes Service (IKS). For IKS the process of exposing the Istio Ingress with a DNS name and TLS is documented in this article and here based on the Istio Bookinfo sample.
The documentation is very good, I won’t repeat it here. But a little background may be required: When you issue the command to create a DNS entry for the load-balancer (ibmcloud ks nlb-dns create ...), in the background this command also produces a Let’s Encrypt TLS certificate for this DNS entry and it stores this TLS certificate in a Kubernetes secret in the default namespace. The Istio Ingress is running in the istio-system namespace, it cannot access a secret in default. That is the reason for the intermediate step to export the secret with the certificate and recreate it in istio-system.
So how is storing a TLS certificate in a Kubernetes secret secure, it is only base64 encoded and not encrypted? That is true but there is are two possible solutions:
Use a certificate management system like IBM Certificate Manager: Certificate Manager uses the Hardware Security Module (HSM)-based IBM Key Protect service for storing root encryption keys. Those root encryption keys are used to wrap per-tenant data encryption keys, which are in turn used to encrypt per-certificate keys which are then stored securely within Certificate Manger databases.
Add a Key Management System (KMS) to the IKS cluster on the IBM Cloud. There is even a free option, IBM Key Protect for IBM Cloud, or for the very security conscious there is the IBM Hyper Protect Crypto Service. Both can be used to encrypt the etcd server of the Kubernetes API server and Kubernetes secrets. You would need to manage the TLS certificates yourself, though.
Or use both, the certificate management system to manage your TLS certificates and the KMS for the rest.
We didn’t cover adding a certificate management system or a KMS in our workshop to keep it simple. But there is a huge documentation section on many aspects of protecting sensitive information in your cluster on the IBM Cloud:
Picture 3 (c) IBM Corp.
Istio Security
In my opinion, Istio is a very important and useful addition to Kubernetes when you work with Microservices architectures. It has features for traffic management, security, and observability. The Istio documentation has a very good section on Istio security features.
In our example we set up Istio with “pod auto-injection” enabled for the default namespace. This means that into every pod that is deployed into the default namespace, Istio deploys an additional container, the Envoy proxy. Istio then changes the routing information in the pod so that all other containers in the pod communicate with services in other pods only through this proxy. For example, when the Web-API service calls the REST API of the Articles service, the Web-API container in the Web-API pod connects to the Envoy proxy in the Web-API pod which makes the request to the Envoy proxy in the Articles pod which passes the request to the Articles container. Sounds complicated but it happens automagically.
The Istio control plane contains a certificate authority (CA) that can manage keys and certificates. This Istio CA creates a X.509 certificate for every Envoy proxy and this certificate can be used for encryption and authentication in the service mesh.
(c) istio.io
You can see in picture 2 that each of our pods is running an Envoy sidecar and each sidecar holds a (X.509) certificate, including the Istio Ingress which is of course part of the service mesh, too.
With the certificates in place in all the pods, all the communication in the service mesh is automatically encrypted using mutual TLS or mTLS. mTLS means that in the case of a client service (e.g. Web-API) calling a server service (e.g. Articles) both sides can verify the authenticity of the other side. When using “simple” TLS, only the client can verify the authenticity of the server, not vice versa.
The Istio CA even performs automatic certificate and key rotation. Imagine what you would need to add to your code to implement this yourself!
You still need to configure the Istio Ingress Gateway. “Gateway” is an Istio configuration resource. This is what its definition looks like
This requires that you followed the instructions that I linked in the previous section “Accessing the application with TLS”. These instructions create the DNS hostname specified in the hosts: variable and the TLS privateKey and serverCertificate in the correct location.
Now you can access the Istio Ingress using the DNS hostname and only (encrypted) HTTPS as protocol. HTTPS is terminated at the Istio Ingress which means the communication is decrypted there, the Ingress has the required keys to do so. The Istio Ingress is part of the Istio Service Mesh so all the communication between the Ingress and any other service in the mesh will be re-encrypted using mTLS. This happens automatically.
We also need to define an Istio VirtualService for the Istio Ingress Gateway to configure the internal routes:
The DNS hostname is specified in the hosts: variable, again.
There are 3 routing rules in this example:
https://harald-uebele-k8s-1234567890-0001.eu-de.containers.appdomain.cloud/auth will route the request to the Keycloak service, port 8080. If you know Keycloak you will know that 8080 is the unencrypted port!
https://harald-uebele-k8s-1234567890-0001.eu-de.containers.appdomain.cloud/articles to the Web-API service, port 8081.
Calling https://harald-uebele-k8s-1234567890-0001.eu-de.containers.appdomain.cloud without a path sends the request to Web-App service which basically is a Nginx webserver listending on port 80. Again: http only!
Is this secure? Yes, because all involved parties establish their service mesh internal communications via the Envoy proxies and those will encrypt traffic.
Can it be more secure? Yes, because the Istio service mesh is using mTLS in “permissive” mode. So you can still access the services via unencrypted requests. This is done on purpose to allow you to migrate into a Istio service mesh without immediately breaking your application. In our example you could still call the Artictles service using its NodePort which effectively bypasses Istio security.
Switching to STRICT mTLS
STRICT means that mTLS is enforced for communication in the Istio service mesh. No unencrypted and (X.509!) no unauthorized communication is possible. This eliminates pretty much the possibility of man-in-the-middle attacks.
The PeerAuthentication policy can be set mesh wide, for a namespace, or for a workload using a selector. In this example the policy is set for namespace default.
Once this definition is applied, only mTLS encrypted traffic is possible. You cannot access any service running inside the Istio service mesh by calling it on its NodePort. This also means that services running inside the service mesh can not call services outside without going through an Istio Egress Gateway.
You can do even more with Istio without changing a line of your code. The Istio security concepts and security tasks gives a good overview of what is possible.
I have written about Knative Installation, Knative Serving, and Knative Eventing. I have used the simple HelloWorld sample application which is perfectly fine to learn Knative. But I wanted to apply what I have learned with an example that is closer to reality. If you have followed my blog, you should know our pet project Cloud Native Starter. It contains sample code that demonstrates how to get started with cloud-native applications and microservice based architectures.
Cloud Native Starter is basically made up of 3 microservices: Web-API, Articles, and Authors. I have used it for an Istio hands-on workshop where one of the objectives is Traffic Management:
A browser-based application requests a list of blog articles from the Web-API via the Istio Ingress.
The Web-API service retrieves a list of blog articles from the Articles services, and for every article it retrieves author details from the Authors service.
There are two versions of the Web-API service.
Container images for all services are available on my Docker Hub repository.
I think this is perfect to exercise my new Knative skills.
For this example I wanted to give Minikube another try. In my first blog about Knative installation I had issues with Minikube together with Knative 0.12 which has specific instructions on how to install it on Minikube. I have now tested Minikube v1.11.0 with Knative Serving 0.15 and Kourier as networking layer using the default Knative 0.15 installation instructions and I am happy to report:
Knative Serving 0.15 works on Minikube!
Here is the experience with Cloud Native Starter and Knative:
Microservice 1: Authors
The simplest service is Authors, I started to deploy it with a simple Knative YAML file:
The only additional configuration are the two environment variables, DATABASE and CLOUDANT_URL. With those the service could be configured to use an external Cloudant database to store the author information. With the settings above, authors information is stored in memory (local) only.
When you deploy this on Minikube, it creates a Knative service
$ kn service list
NAME       URL                                         LATEST        AGE     CONDITIONS   READY   REASON
authors    http://authors.default.example.com          authors-v1    12s     3 OK / 3     True
It shows that the service listens on the URL:
http://authors.default.example.com
This URL cannot be called directly, it is not resolvable via DNS unless you are able to configure your DNS server or use a local hosts file. With a “real” Kubernetes or OpenShift cluster with a real Ingress e.g. provisioned on the IBM Cloud these steps would not be necessary. To be able to call the API, we need the IP address of the Minikube “worker” node:
$ minikube ip
192.168.39.169
And here you can find the NodePort of the Kourier ingress:
kubectl get svc kourier -n kourier-system
NAME      TYPE           CLUSTER-IP       EXTERNAL-IP   PORT(S)                      AGE
kourier   LoadBalancer   10.109.186.248   <pending>     80:30265/TCP,443:31749/TCP   4d1h
The NodePort that serves HTTP is 30265. The correct Ingress IP address is therefore: 192.168.39.169:30265
A REST API call to the Authors service using ‘curl’ is then build like this:
In this way the Ingress gets the request with the correct host name in the request header.
‘authors.default.example.com’ is an external URL. But the Authors service needs to be called internally only, it shouldn’t be exposed to the outside. A Knative service can be configured as ‘private cluster-local‘. This is done by tagging either the Knative service or the route:
$ kn service list
NAME       URL                                         LATEST        AGE    CONDITIONS   READY   REASON
authors    http://authors.default.svc.cluster.local    authors-v1    84m    3 OK / 3     True
The URL is now cluster-local. We can also accomplish that by adding an annotation to the YAML file. This saves one step but we are no longer able test the API in a simple manner with curl.
Articles uses a ConfigMap which needs to be created, too.
In the spec.containers section, environment variables are pulled from the ConfigMap and also liveness and readiness probes are defined. Articles is already tagged as ‘cluster-local’, it will only be callable from within the cluster.
Deploy and check shows nothing unusual:
$ kn service list
NAME       URL                                         LATEST        AGE    CONDITIONS   READY   REASON
articles   http://articles.default.svc.cluster.local   articles-v1   53s    3 OK / 3     True
authors    http://authors.default.svc.cluster.local    authors-v1    99m    3 OK / 3     True
Since Articles is cluster-internal, it can not be tested. You could use another container in the cluster that can be SSHed into, e.g. an otherwise empty Fedora container, and call the API from there. So I think the best practice during development is to tag the service cluster-only via command as explained in the Authors service section and not use the label in the YAML file. That way you can test the API using curl via external URL and switch to cluster-only once you are confident that the service works as expected.
Microservice 3: Web-API
This is the service that caused the most trouble although the YAML to deploy it is quite simple:
Nothing happens, the call seems to hang, it returns an empty object. The error log shows:
[err] com.ibm.webapi.business.getArticles: Cannot connect to articles service
What is wrong? Digging into the code reveals that Web-API issues REST requests to the wrong URL, e.g. for Articles:
static final String BASE_URL = "http://articles:8080/articles/v1/";
Identical situation for Authors:
static final String BASE_URL = "http://authors:3000/api/v1/";
The URLs are correct for Kubernetes, both services run in the same namespace and can be called by simply using their name. And they listen on different ports. For Knative they need to be changed to call http://articles.default.svc.cluster.local/articles/v1/ and http://authors.default.svc.cluster.local/api/v1/, both without port definition because Knative and its Ingress require fully qualified DNS names and expose HTTP on port 80. I have changed the code, recompiled the two versions of Web-API and created Container Images on Docker Hub: docker.io/haraldu/web-api:knative-v1 and docker.io/haraldu/web-api:knative-v2 (which we need later).
Testing with ‘curl’ still gives no result, but checking of the pods shows why:
$ kubectl get pod
NAME READY STATUS RESTARTS AGE
articles-v1-deployment-5ddf9869c7-rslv5 0/2 Running 0 22s
web-api-v1-deployment-ff547b857-pc5ms 2/2 Running 0 2m8s
Articles has been scaled to zero and it is still in the process of starting (READY: 0/2). It is a traditional Java app and takes some time to start. initialDelaySeconds parameters for liveness and readiness probes add some additional delay. Authors has been scaled to zero, too, but as a Node.js app it starts quickly. For Java based microservices that are supposed to be deployed on Knative, Quarkus is definitely a better choice as it reduces startup time dramatically.
Disable Scale-to-Zero
This is the modified YAML for Articles, it includes the cluster-local label and the minScale: "1" that prevents scale to zero:
In the architecture diagram at the very beginning of this article you can see two versions of Web-API. Their difference is: Version 1 displays a list of 5 articles, Version 2 displays 10 articles. If you deploy a new version of a microservice you will most likely want to test it first, maybe as a canary deployment on a subset of users using Traffic Management.
In the image section, the knative-v2 Container image is referenced.
The traffic sections performs a 75% / 25% split between Version 1 and Version 2. If you know Istio you will know where this function comes from. You will also know how much needs to be configured to enable traffic management with Istio: VirtualService, DestinationRule, and entries to the Ingress Gateway configuration.
Conclusion and further information
This was the description of an almost “real life” microservices example on Knative. You have seen that with typical Java based microservices with their long start-up times the serverless scale-to-zero pattern doesn’t work. If you want to use Java together with scale-to-zero, you need to utilize recent developments in Java like Quarkus with its impressively fast start-up.
So is Knative worth the effort and resources? I am not sure about Knative Eventing. But Knative Serving with its easier deployment files and the easy implementation of auto-scaling and traffic management are definitely worth a try. But keep in mind that Knative is not well suited for every workload that you would deploy on Kubernetes.
Additional reading:
Knative documentation, https://knative.dev/docs
Red Hat Knative Tutorial, https://redhat-developer-demos.github.io/knative-tutorial
Deploying serverless apps with Knative, https://cloud.ibm.com/docs/containers?topic=containers-serverless-apps-knative
Knative Eventing allows to pass events from an event producer to an event consumer. Knative events follow the CloudEvents specification.
Event producers can be anything:
“Ping” jobs that periodically send an event
Apache CouchDB sending an event when a record is written, changed, or deleted
Kafka Message Broker
Github repository
Kubernetes API Server emitting cluster events
and many more.
An event consumer is any type of code running on Kubernetes (typically) that is callable. It can be a “classic” Kubernetes deployment and service, and of course in can be a Knative Service.
A good source to learn Knative eventing is the Knative documentation itself and the Red Hat Knative Tutorial. I think, the Red Hat tutorial is better structured and more readable.
There are three usage patterns for Knative Eventing, the first one being the simplest:
Source to Sink
In this case, the source sends a message to a sink, there is no queuing or filtering, it is a one-to-one relationship.
(c) Red Hat, Inc.
Knative Event Sources are Knative objects. The following sources are installed when Knative is installed:
There are many more sources, e.g. a Kafka Source or a CouchDB Source, but they need to be installed separately. To get a basic understanding of Knative eventing, the PingSource is sufficient. It creates something comparable to a cron job on Linux that periodically emits a message.
The Source links to the Sink so it is best to define/deploy the Sink first. It is a simple Knative Service, the code snippets are all from the Red Hat Knative Tutorial:
The Schedule is typical cron, it defines that the “ping” happens every 2 minutes.
jsonData is the (fixed) message that is transmitted.
sink defines the Knative Service that the Source connects to: eventinghello.
When both elements are deployed we can see that an eventinghello pod is started every two minutes, in its log we can see the message ‘{“key”: “every 2 mins”}’. The pod itself terminates after about 60 to 70 seconds (Knative scale to zero) and another pod is started after the 2 minutes interval of the PingSource are over and the next message is sent.
To recap the Source-to-Sink pattern: it connects an event source with an event sink in a one-to-one relation. In my opinion it is a starting point to understand Knative Eventing terminology but it would be an incredible waste of resources if this were the only available pattern. The next pattern is:
Channel and Subscription
A Knative Channel is a custom resource that can persist events and allows to forward events to multiple destinations (via subscriptions). There are multiple channel implementations: InMemoryChannel, KafkaChannel, NATSChannel, etc.
By default all Knative Channels in a Kubernetes cluster use the InMemoryChannel implementation. The Knative documentation describes InMemoryChannels as “a best effort Channel. They should NOT be used in Production. They are useful for development.” Characteristics are:
No Persistence: When a Pod goes down, messages go with it. No Ordering Guarantee: There is nothing enforcing an ordering, so two messages that arrive at the same time may go to subscribers in any order. Different downstream subscribers may see different orders. No Redelivery Attempts: When a subscriber rejects a message, there is no attempts to retry sending it. Dead Letter Sink: When a subscriber rejects a message, this message is sent to the dead letter sink, if present, otherwise it is dropped.
A lot of restrictions but it is much easier to set up compared to the KafkaChannel where you need to create a Kafka Server first.
Knative Eventing is very configurable here: you can change the cluster wide Channel default and you can change the Channel implementation per namespace. For example you can keep InMemoryChannel as the cluster default but use KafkaChannel in one or two projects (namespaces) with much higher requirements for availability and message delivery.
A Knative Subscription connects (= subscribes) a Sink service to a Channel. Each Sink service needs its own Subscription to a Channel.
Coming from the Source to Sink pattern in the previous section, the Source to Sink relation is now replaced with a Source to Channel relation. One or multiple Sink services subscribe to the Channel:
(c) Red Hat, Inc.
The Channel and Subscription pattern decouples the event producer (Source) from the event consumer (Sink) and allows for a one to many relation between Source and Sink. Every message / event emitted by the Source is forwarded to one or many Sinks that are subscribed to the Channel.
The next pattern (Broker and Trigger) extends the Channel and Subscription pattern and is the most interesting scenario. Therefore I won’t go into more detail here but the Red Hat Knative Tutorial has an example for Channel and Subscriber.
Brokers and Triggers
A Broker is a Knative custom resource that is composed of at least two distinct objects, an ingress and a filter. Events are sent to the Broker ingress, the filter strips all metadata from the event data that is not part of the CloudEvent. Brokers typically use Knative Channels to deliver the events.
This is the definition of a Knative Broker:
apiVersion: eventing.knative.dev/v1beta1
kind: Broker
metadata:
  name: default
spec:
  # Configuration specific to this broker.
  config:
    apiVersion: v1
    kind: ConfigMap
    name: config-br-default-channel
    namespace: knative-eventing
A Trigger is very similar to a Subscription, it subscribes to events from a specific Broker but the most interesting aspect is that it allows filtering on specific events based on their CloudEvent attributes:
I think this is were Knative Eventing gets interesting. Why would you install an overhead of resources (called Knative Eventing) into your Kubernetes cluster to simply send a message / event from one pod to another? But with an event broker that receives a multitude of different events and triggers that filter out a specific event and route that to a specific (micro) service I can see an advantage.
(c) Red Hat, Inc.
This is the slightly modified example from the Red Hat Knative Tutorial:
To create a default broker requires no YAML. To use the default Broker for a Kubernetes namespace just add a label:
This will automatically create the required resources. To check:
$ kubectl get broker
NAME      READY   REASON   URL                                                       AGE
default   True             http://default-broker.knativetutorial.svc.cluster.local   3d19h

$ kubectl get channel
NAME                                                        READY   REASON   URL                                                                       AGE
inmemorychannel.messaging.knative.dev/default-kne-trigger   True             http://default-kne-trigger-kn-channel.knativetutorial.svc.cluster.local   3d19h
The first command shows the “default” broker is ready and listens to the URL http://default-broker.knativetutorial.svc.cluster.local. The second command shows that our default broker uses the InMemoryChannel implementation.
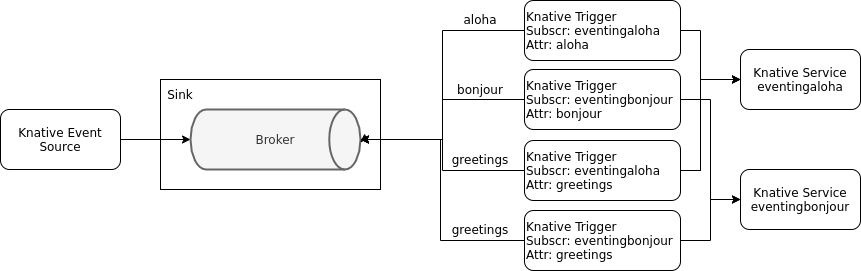
The example implements 2 services (sinks) to receive events: eventingaloha and eventingbonjour.
They are exactly the same, they are based on the same container image, only the name is different. The name will help to distinguish which service received an event.
When everything is set up, we will send three different event types to the broker: ‘aloha’, ‘bonjour’, and ‘greetings’. The ‘aloha’ type should go to the eventingaloha service, ‘bonjour’ to the eventingbonjour service, and ‘greetings’ to both. To accomplish this we need triggers.
Triggers have some limitations. First, you can filter on multiple attributes, e.g.:
But the attributes are always AND: ‘dev.knative.foo.bar’ AND ‘my-extension-value’. We cannot define a trigger that would filter on ‘aloha’ OR ‘greetings’. We need 2 triggers for that.
Also a trigger can only define a single subscriber (service). We cannot define a trigger for ‘greetings’ with both the eventingaloha service and the eventingbonjour service as subscribers.
This means we will need 4 Trigger configurations:
If you start to seriously work with Knative Triggers, think about a good naming convention for them first. Otherwise troubleshooting could be difficult in case the triggers don’t work as expected: OpenShift Web Console does a very good job at visualizing Knative objects but it ignores Triggers. And this is what you see in the command line:
$ kubectl get trigger
NAME               READY   REASON   BROKER    SUBSCRIBER_URI   AGE
alohaaloha         True             default                    21h
bonjourbonjour     True             default                    21h
greetingsaloha     True             default                    21h
greetingsbonjour   True             default                    21h
Our example now looks like this:
We have the Knative default Broker, 4 Knative Triggers that filter on specific event attributes and pass the events to one or both of the 2 Knative eventing services. We don’t have an event source yet.
A little further up we saw that the broker listens to the URL http://default-broker.knativetutorial.svc.cluster.local
We will now simply start a pod in our cluster based on a base Fedora image that contains the curl command based on this curler.yaml:
If we are fast enough we can check its logs and see our event has been forwarded:
2020-06-09 08:38:22,348 INFO eventing-hello ce-id=say-hello
2020-06-09 08:38:22,349 INFO eventing-hello ce-source=mycurl
2020-06-09 08:38:22,350 INFO eventing-hello ce-specversion=1.0
2020-06-09 08:38:22,351 INFO eventing-hello ce-time=2020-06-09T08:38:12.512544667Z
2020-06-09 08:38:22,351 INFO eventing-hello ce-type=bonjour
2020-06-09 08:38:22,352 INFO eventing-hello content-type=application/json
2020-06-09 08:38:22,355 INFO eventing-hello content-length=21
2020-06-09 08:38:22,356 INFO eventing-hello POST:{"key":"from a curl"}
In the last test we send the ‘greetings’ type event:
And as expected we see pods in both services are started:
Using Apache Kafka
I didn’t go through the Knative Kafka Example. But since it is hard to find and also the preferable method of setting up a production scale Broker & Trigger pattern for Knative Eventing, I wanted to have it documented here.
There are actually 2 parts in the Kafka example:
Start with Installing Apache Kafka: This will probably work in OpenShift (and CRC), too. But depending on the OpenShift version I would start to install the Strimzi or the Red Hat AMQ Streams operator from the OperatorHub catalog in the OpenShift Web Console and create a Kafka cluster with the help of the installed operator.
Continue with the Apache Channel Example. This example installs a Kafka Channel and uses it together with the Knative Default Broker. In the end, an Event Sink is created, a Trigger that connects the Sink to the Broker, and an Event Source (that uses the Kubernetes API Server to generate events).
Knative Eventing Recap
I have had a look now at both Knative Serving and Knative Eventing:
I really like Knative Serving, I think it can help a developer be more productive.
I am undecided about Eventing, though. The Broker & Trigger example based on the InMemoryChannel is easy to set up. But using the InMemoryChannel is for testing and learning only, it is not viable for production. And if I set up my cluster with an instance of Apache Kafka I do ask myself why I should take the messaging detour through Eventing and not use Kafka Messaging in my code directly.
In the first part of this series I went through the installation of Knative on CodeReady Containers which is basically Red Hat OpenShift 4.4 running on a notebook.
In this second part I will cover Knative Serving, which is responsible for deploying and running containers, also networking and auto-scaling. Auto-scaling allows scale to zero and is probably the main reason why Knative is referred to as Serverless platform.
Before digging into Knative Serving let me share a piece of information from the Knative Runtime Contract which helps to position Knative. It compares Kubernetes workloads (general-purpose containers) with Knative workloads (stateless request-triggered containers):
“In contrast to general-purpose containers, stateless request-triggered (i.e. on-demand) autoscaled containers have the following properties:
Little or no long-term runtime state (especially in cases where code might be scaled to zero in the absence of request traffic).
Logging and monitoring aggregation (telemetry) is important for understanding and debugging the system, as containers might be created or deleted at any time in response to autoscaling.
Multitenancy is highly desirable to allow cost sharing for bursty applications on relatively stable underlying hardware resources.“
Or in other words: Knative sees itself better suited for short running processes. You need to provide central logging and monitoring because the pods come and go. And multi-tenant hardware can be provided large enough to scale for peaks and at the same time make effective use of the resources.
As a developer, I would expect Knative to make my life easier (Knative claims that it is “abstracting away the complex details and enabling developers to focus on what matters”) but instead when coming from Kubernetes it gets more complicated and confusing at first because Knative uses new terminology for its resources. They are:
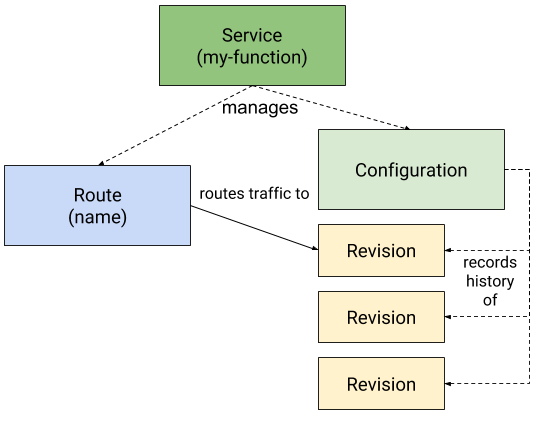
Service: Responsible for managing the life cycle of an application/workload. Creates and owns the other Knative objects Route and Configuration.
Route: Maps a network endpoint to one or multiple Revisions. Allows Traffic Management.
Configuration: Desired state of the workload. Creates and maintains Revisions.
Revision: A specific version of a code deployment. Revisions are immutable. Revisions can be scaled up and down. Rules can be applied to the Route to direct traffic to specific Revisions.
(c) knative.dev
Did I already mention that this is confusing? We now need to distinguish between Kubernetes services and Knative services. And on OpenShift, between OpenShift Routes and Knative Routes.
Enough complained, here starts the interesting part:
Creating a sample application
I am following this example from the Knative web site which is a simple Hello World type of application written in Node.js. The sample is also available in Java, Go, PHP, Python, Ruby, and some other languages.
Instead of using the Docker build explained in the example I am using an OpenShift Binary build which builds the Container image on OpenShift and stores it as an Image stream in the OpenShift Image Repository. Of course, the Container image could also be on Docker Hub or Quay.io or any other repository that you can access. If you follow the Knative example step by step, you create the Node.js application, a Dockerfile, and some more files. On OpenShift, for the Binary build, we need the application code and the Dockerfile and then create an OpenShift project and the Container image with these commands:
If you are familiar with Kubernetes, you have to start to pay close attention to the first line, to see that this is the definition of a Knative Service.
All you need for your deployment are the highlighted lines, specifically the first ‘metadata’.’name’ and the ‘containers’.’images’ specification to tell Kubernetes where to find the Container image.
Line 11 specifies the location of the Container image just like every other Kubernetes deployment description. In this example, the ‘helloworld’ image is the Image stream in the OpenShift internal Image Repository in a project called ‘knativetutorial’. It is the result of the previous section “Creating a sample application”.
Lines 12, 13, and 14 are setting an environment variable and are used to “create” different versions. (In the Hello World code, the variable TARGET represents the “World” part.)
Lines 7 and 8, ‘metadata’ and ‘name’, are optional but highly recommended. They are used to provide arbitrary names for the Revisions. If you omit this second name, Knative will use default names for the Revisions (“helloworld-nodejs-xhz5df”) and if you have more than one version/revision this makes it difficult to distinguish between them.
With CRC and Knative correctly set up, I simply deploy the service using oc:
$ oc apply -f service.yaml
service.serving.knative.dev/helloworld-nodejs created
The reply isn’t very spectacular but if you look around (oc get all) you can see that a lot has happened:
A Kubernetes Pod is created, running two containers: user-container and Envoy
Multiple Kubernetes services are created, one is equipped with an OpenShift route
An OpenShift Route is created
A Kubernetes deployment and a replica-set are created
Knative service, configuration, route, and revision objects are created
It would have taken a YAML file with a lot more definitions and specifications to accomplish all that with plain Kubernetes. I would say that the Knative claim of “abstracting away the complex details and enabling developers to focus on what matters” is definitely true!
Take a look at the OpenShift Console, in the Developer, Topology view:
I really like the way the Red Hat OpenShift developers have visualized Knative objects here.
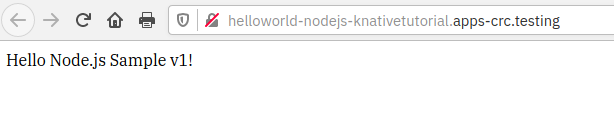
If you click on the link (Location) of the Route, you will see the helloworld-nodejs response in a browser:
If you wait about a minute or so, the Pod will terminate: “All Revisions are autoscaled to 0”. If you click on the Route location (URL) then, a Pod will be spun up again.
Another good view of the Knative service is available through the kn CLI tool:
$ kn service list
NAME                URL                                                         LATEST                 AGE   CONDITIONS   READY   REASON
helloworld-nodejs   http://helloworld-nodejs-knativetutorial.apps-crc.testing   helloworld-nodejs-v1   13m   3 OK / 3     True

$ kn service describe helloworld-nodejs
Name:       helloworld-nodejs
Namespace:  knativetutorial
Age:        15m
URL:        http://helloworld-nodejs-knativetutorial.apps-crc.testing

Revisions:
  100%  @latest (helloworld-nodejs-v1) [1] (15m)
        Image:  image-registry.openshift-image-registry.svc:5000/knativetutorial/helloword:latest (at 53b1b4)

Conditions:
  OK TYPE                   AGE REASON
  ++ Ready                  15m
  ++ ConfigurationsReady    15m
  ++ RoutesReady            15m
Adding a new revision
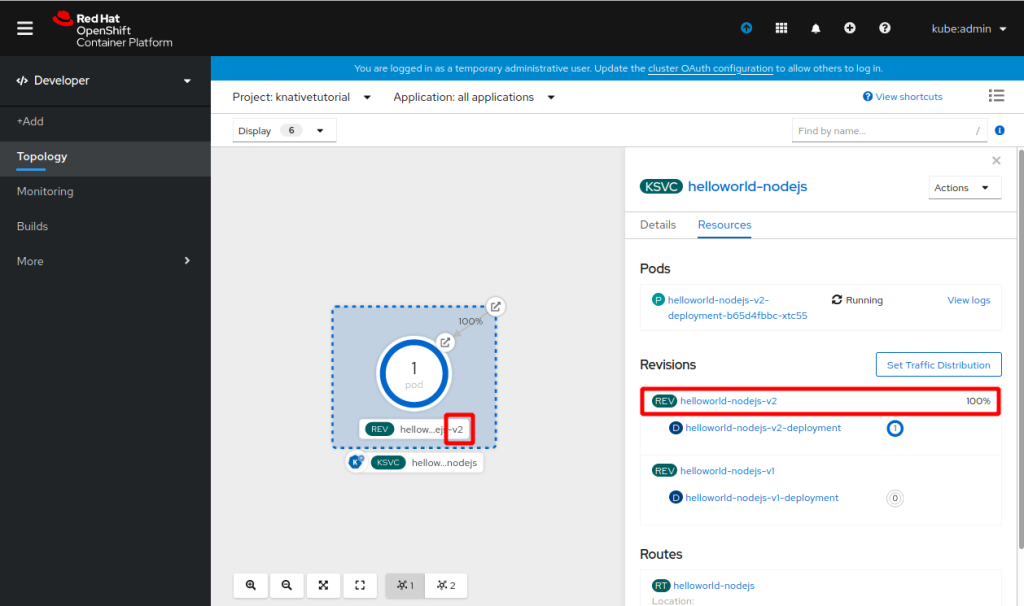
I will now create a second version of our app and deploy it as a second Revision using a new file, service-v2.yaml:
This will create a 75% / 25% distribution between revision 1 and 2. Deploy the change and watch in the OpenShift Web Console:
Have you ever used Istio? To accomplish this with Istio requires configuring the Ingress Gateway plus defining a Destination Rule and a Virtual Service. In Knative it is just adding a few lines of code to the Service description. Have you noticed the “Set Traffic Distribution” button in the screen shot of the OpenShift Web Console? Here you can modify the distribution on the fly:
Auto-Scaling
Scale to zero is an interesting feature but without additional tricks (like pre-started containers or pods which aren’t available in Knative) it can be annoying because users have to wait until a new pod is started and ready to receive requests. Or it can lead to problems like time-outs in a microservices architecture if a scaled-to-zero service is called by another service and has to be started first.
On the other hand, if our application / microservice is hit hard with requests, a single pod may not be sufficient to serve them and we may need to scale up. And preferably scale up and down automatically.
Auto-scaling is accomplished by simply adding a few annotation statements to the Knative Service description:
apiVersion: serving.knative.dev/v1
kind: Service
metadata:
  name: helloworld-nodejs
spec:
  template:
    metadata:
      name: helloworld-nodejs-v3
      annotations:
        # the minimum number of pods to scale down to
        autoscaling.knative.dev/minScale: "1"
        # the maximum number of pods to scale up to
        autoscaling.knative.dev/maxScale: "5"
        # Target in-flight-requests per pod.
        autoscaling.knative.dev/target: "1"
    spec:
      containers:
        - image: image-registry.openshift-image-registry.svc:5000/knativetutorial/helloword:latest
          env:
            - name: TARGET
              value: "Node.js Sample v3 -- Scaling"
minScale: “1” prevents scale to zero, there will always be at least 1 pod active.
maxScale: “5” will allow to start a maximum of 5 pods.
target: “1” limits every started pod to 1 concurrent request at a time, this is just to make it easier to demo.
All auto-scale parameters are listed and described here.
Here I deployed the auto-scale example and run a load test using the hey command against it:
In the end of the output we see 5 pods are started, one of them for a longer time (2m 35s) than the rest. That is the minScale: “1” pre-started pod.
Jakarta EE Example from Cloud Native Starter
I wanted to see how easy it is to deploy any form of application using Knative Serving.
I used the authors-java-jee microservice that is part of our Cloud Native Starter project and that we use in an exercise of an OpenShift workshop. A Container image of this service is stored on Dockerhub in my colleague Niklas Heidloffs registry as nheidloff/authors:v1
When I deployed this I noticed that it never starts (you need to scroll the following view to the right to see the problem):
$ kn service list
NAME          URL                                                   LATEST   AGE   CONDITIONS   READY     REASON
authors-jee   http://authors-jee-knativetutorial.apps-crc.testing            33s   0 OK / 3     Unknown   RevisionMissing : Configuration "authors-jee" is waiting for a Revision to become ready.

$ oc get pod
NAME                                         READY   STATUS    RESTARTS   AGE
authors-jee-v1-deployment-7dd4b989cf-v9sv9   1/2     Running   0          42s
The user-container in the pod never starts and the Revision never becomes ready. Why is that?
To understand this problem you have to know that there are two versions of the authors service: The first version is written in Node.js and listens on port 3000. The second version is the JEE version we try to deploy here. To make it a drop-in replacement for the Node.js version it is configured to listen on port 3000, too. Very unusual for JEE and something Knative obviously does not pick up from the Docker metadata in the image.
The Knative Runtime Contract has some information about Inbound Network Connectivity, Protocols and Ports:
“The developer MAY specify this port at deployment; if the developer does not specify a port, the platform provider MUST provide a default. Only one inbound containerPort SHALL be specified in the core.v1.Container specification. The hostPort parameter SHOULD NOT be set by the developer or the platform provider, as it can interfere with ingress autoscaling. Regardless of its source, the selected port will be made available in the PORT environment variable.”
I found another piece of information regarding containerPort in the IBM Cloud documentation about Knative:
By default, all incoming requests to your Knative service are sent to port 8080. You can change this setting by using the containerPort specification.
I modified the Knative service yaml with ports.containerPort info:
$ kn service list
NAME          URL                                                   LATEST           AGE   CONDITIONS   READY   REASON
authors-jee   http://authors-jee-knativetutorial.apps-crc.testing   authors-jee-v2   11m   3 OK / 3     True

$ oc get pod
NAME                                        READY   STATUS    RESTARTS   AGE
authors-jee-v2-deployment-997d44565-mhn7w   2/2     Running   0          51s
The authors-java-jee microservice is using Eclipse Microprofile and has implemented specific health checks. They can be used as Kubernetes readiness and liveness probes, the YAML file then looks like this, syntax is exactly the standard Kubernetes syntax:
Microservices Architectures and Knative private services
So far the examples I tested where all exposed on public URLs using the Kourier Ingress Gateway. This is useful for testing and also for externally accessible microservices, e.g. backend-for-frontend services that serve a browser-based web front end or a REST API for other external applications. The multitude of microservices in a cloud native application will only and should only be called cluster local and not be exposed with an external URL.
The Knative documentation has information on how to label a service cluster-local. You can either add a label to the Knative service or the Knative route. The steps described in the documentation are to 1. deploy the service and then 2. convert it to cluster-local via the label.
You can easily add the label to the YAML file and immediately deploy a cluster-local Knative service. This is the modified Jakarta EE example of the previous section:
When this is deployed to OpenShift, the correct URL shows up in the Route:
Of course you can no longer open the URL in your browser, this address is only available from within the Kubernetes cluster.
Debugging Tips
There are new places to look for information as to why a Knative service doesn’t work. Here is a list of helpful commands and examples:
Display the Knative service:
$ kn service list
NAME          URL                                                   LATEST   AGE    CONDITIONS   READY   REASON
authors-jee   http://authors-jee-knativetutorial.apps-crc.testing            3m7s   0 OK / 3     False   RevisionMissing : Configuration "authors-jee" does not have any ready Revision.
It is normal and to be expected that the revision is not available for some time immediately after the deployment because the application container needs to start first. But in this example the revision isn’t available after over 3 minutes and that is not normal.
You can also display Knative service info using oc instead of kn by using ‘kservice’:
$ oc get kservice
NAME          URL                                                   LATESTCREATED    LATESTREADY   READY   REASON
authors-jee   http://authors-jee-knativetutorial.apps-crc.testing   authors-jee-v2                 False   RevisionMissing
2. Check the pod:
$ oc get pod
No resources found in knativetutorial namespace.
That is bad: no pod means no logs to look at.
3. Get information about the revision:
$ oc get revision
NAME             CONFIG NAME   K8S SERVICE NAME   GENERATION   READY   REASON
authors-jee-v2   authors-jee                      1            False   ContainerMissing

$ oc get revision authors-jee-v2 -o yaml
apiVersion: serving.knative.dev/v1
kind: Revision
[...]
status:
  conditions:
  - lastTransitionTime: "2020-06-03T08:12:49Z"
    message: 'Unable to fetch image "docker.io/nheidloff/authors:1": failed to resolve
      image to digest: failed to fetch image information: GET https://index.docker.io/v2/nheidloff/authors/manifests/1:
      MANIFEST_UNKNOWN: manifest unknown; map[Tag:1]'
    reason: ContainerMissing
    status: "False"
    type: ContainerHealthy
  - lastTransitionTime: "2020-06-03T08:12:49Z"
    message: 'Unable to fetch image "docker.io/nheidloff/authors:1": failed to resolve
      image to digest: failed to fetch image information: GET https://index.docker.io/v2/nheidloff/authors/manifests/1:
      MANIFEST_UNKNOWN: manifest unknown; map[Tag:1]'
    reason: ContainerMissing
    status: "False"
    type: Ready
  - lastTransitionTime: "2020-06-03T08:12:47Z"
    status: Unknown
    type: ResourcesAvailable
[...]
The conditions under the status topic show that I have (on purpose as a demo) mistyped the Container image tag.
This is a real example:
$ oc get revision helloworld-nodejs-v1 -o yaml
[...]
status:
  conditions:
  - lastTransitionTime: "2020-05-28T06:42:14Z"
     message: The target could not be activated.
     reason: TimedOut
     severity: Info
     status: "False"
     type: Active
  - lastTransitionTime: "2020-05-28T06:40:04Z"
     status: Unknown
     type: ContainerHealthy
  - lastTransitionTime: "2020-05-28T06:40:05Z"
     message: '0/1 nodes are available: 1 Insufficient cpu.'
     reason: Unschedulable
     status: "False"
     type: Ready
  - lastTransitionTime: "2020-05-28T06:40:05Z"
     message: '0/1 nodes are available: 1 Insufficient cpu.'
     reason: Unschedulable
       status: "False"
       type: ResourcesAvailable
These conditions clearly show that the cluster is under CPU pressure and unable to schedule a new pod. This was on my first CRC configuration that used only 6 vCPUs.
—
In my next blog article in this series I will talk about Knative Eventing.
I have worked with Kubernetes for quite some time now, also with Istio Service Mesh. Recently I decided that I want to explore Knative and its possibilities.
So what is Knative? The Knative web site describes it as “components build on top of Kubernetes, abstracting away the complex details and enabling developers to focus on what matters.” It has two distinct components, originally it were three:
Knative Build. It is no longer part of Knative, it is now a project of its own: “Tekton“
Knative Serving, responsible for deploying and running containers, also networking and auto-scaling. Auto-scaling allows scale to zero and is the main reason why Knative is referred to as Serverless platform.
Knative Eventing, connecting Knative services (deployed by Knative Serving) with events or streams of events.
This will be a series of blogs about installing Knative, Knative Serving, and Knative Eventing.
In order to explore Knative you need to have access to an instance, of course, and that may require installing it yourself. The Knative documentation (for v0.12) has instructions on how to install it on many different Kubernetes platforms, including Minikube. Perfect, Knative on my notebook.
Installation
I followed the instructions for Minikube and installed it, and started a tutorial. At some point, I finished for the day, and stopped Minikube. The next morning it wouldn’t start again. I tried to find out what went wrong and in the end deleted the Minikube profile, recreated it, and reinstalled Knative again. Just out of curiosity I restarted Minikube and ran into the very same problem. This time I was a little more successful with my investigation and found this issue: https://github.com/knative/eventing/issues/2544. I thought about moving to Knative 0.14 shortly but then decided to test it on OpenShift. If you read some of my previous blogs you may know that I am a fan of CodeReady Containers (CRC).
Knative on Red Hat OpenShift is called OpenShift Serverless. It has been a preview (“beta”) for quite some time but since end of April 2020 it is GA, generally available, no longer preview only. According to the Red Hat OpenShift documentation OpenShift Serverless v1.7.0 is based on Knative 0.13.2 (as of May 1st, 2020) and it is tested on OpenShift 4.3 and 4.4. The CRC version I am currently using (v1.10) is built on top of OpenShift 4.4. So it should work.
The hardware or cluster size requirements for OpenShift Serverless are steep: minimum 10 CPUs and 40 GB of RAM. I only have 8 vCPUs (4 cores) and 32 GB of RAM in my notebook and I do need to run an Operating System besides CRC but I thought I give it a try. I started Knative installation on a CRC config using 6 vCPUs and 20 GB of RAM and so far it seems to work. I have tried it on smaller configurations and got unschedulable pods (Memory and/or CPU pressure).
Installation is accomplished via an OpenShift Serverless Operator and it took me probably less then 20 minutes to have both Knative Serving and Eventing installed by just following the instructions:
Install the OpenShift Serverless operator
Create a namespace for Knative Serving
Create Knative Serving via the Serverless operators API. This also installs Kourier as “an open-source lightweight Knative Ingress based on Envoy.” Kourier is a lightweight replacement for Istio.
Create a namespace for Knative Eventing
Create Knative Eventing via the Serverless operators API.
I have started and stopped CRC many times now and it doesn’t have the issues that Minikube had.
As a future exercise I will test the Knative Add-on for the IBM Cloud Kubernetes Service. This installs Knative 0.14 together with Istio on top of Kubernetes and requires a minimum of 3 worker nodes with 4 CPUs and 16 GB om memory (b3c.4×16 is the machine specification).
In the next blog article I will cover Knative Serving with an example from the Knative documentation.
I started to learn Kubernetes in its vanilla form. Almost a year ago I made my first steps on Red Hat OpenShift. From then on, going back to vanilla Kubernetes made me miss the easy way you switch namespaces (aka projects) in OpenShift. With ‘oc project’ it is like switching directories on your notebook. You can do that with ‘kubectl’ somehow but it is not as simple.
Recently I found 2 power tools for kubectl: ‘kubectx’ and ‘kubens’. Ahmet Alp Balkan, a Google Software Engineer, created them and open sourced them (https://github.com/ahmetb/kubectx).
The Github repo has installation instructions for macOS and diferent flavours of Linux. When you install them, also make sure to install ‘fzf’ (“A command-line fuzzy finder”, https://github.com/junegunn/fzf), it is a cool addition.
kubens
‘kubens’ allows you to quickly switch namespaces in Kubernetes. Normally you work in ‘default’ and whenever you need to check something or do something in another namespace you need to add the ‘-n namespace’ parameter to your command.
‘kubens istio-system’ will make ‘istio-system’ your new home and a subsequent ‘kubectl get pod’ or ‘kubectl get svc’ will show the pods and services in istio-system. Thats not all.
‘kubens’ without a parameter will list all namespaces and with ‘fzf’ installed too you have a selectable list:
I think that is even better than ‘oc projects’!
kubectx
‘kubectx’ is really helpful when you work with multiple Kubernetes clusters. I typically work with a Kubernetes cluster on the IBM Cloud (IKS) and then very often start CRC (CodeReady Containers) to try something out on OpenShift. When I log into OpenShift, my connection to the IKS cluster drops. It actually doesn’t drop but the kube context is switched to CRC. With ‘kubectx’ you can switch between them.
In this example I have two contexts, one is CRC, the other IKS (Kubernetes on IBM Cloud):
Not exactly easy to know which one is which, isn’t it? But you can set aliases for the entries like this:
You can now switch via the list. In addition, with ‘kubectx -‘ you can switch to the previous context.
When you constantly create new kube contexts, e.g. create new CRC or Minikube instances, this list may grow and get unmanageable. But with ‘kubectx -d <NAME>’ you can delete entries from the list. (They will still be in the kube context, though.)
You want to code Java, not Kubernetes deployment YAML files? And you use Quarkus? You may have seen the announcement blog for Quarkus 1.3.0. Under “much much more” is a feature that is very interesting to everyone using Kubernetes or OpenShift and with a dislike for the required YAML files:
“Easy deployment to Kubernetes or OpenShift
The Kubernetes extension has been overhauled and now gives users the ability to deploy their Quarkus applications to Kubernetes or OpenShift with almost no effort. Essentially the extension now also takes care of generating a container image and applying the generated Kubernetes manifests to a target cluster, after the container image has been generated.“
Kubernetes Extension
This extension generates the Kubernetes and OpenShift YAML (or JSON) files and also manages the automatic deployment using these files.
Container Images
There are actually 3 extensions that can handle automatic build using:
– Jib
– Docker
– OpenShift Source-to-image (s2i)
Both extensions use parameters that are placed into the application.properties file. The parameters are listed in the respective guides of the extensions. Note that I use the term “listed”. Some of these parameters are really just listed without any further explanation.
You can find the list of parameters for the Kubernetes extension here, those for the Container Image extension are here.
I tested the functionality in 4 different scenarios: Minikube, IBM Cloud Kubernetes Service, and Red Hat OpenShift in the form of CodeReady Containers (CRC) and Red Hat OpenShift on IBM Cloud. I will describe all of them here.
Demo Project
I use the simple example from the Quarkus Getting Started Guide as my demo application. The current Quarkus 1.3.1 uses Java 11 and requires Apache Maven 3.6.2+. My notebook runs on Fedora 30 so I had to manually install Maven 3.6.3 because the version provided in the Fedora 30 repositories is too old.
The following command creates the Quarkus Quickstart Demo:
Specifies the container image in the K8s deployment. Result is ‘image: getting-started:1.0’. Make sure there are no excess or trailing spaces! I specify empty registry and group parameters to obtain predictable results.
quarkus.kubernetes.service-type=NodePort
Creates a service of type NodePort, default would be ClusterIP (doesn’t really work with Minikube)
Now do a test compile with
$ ./mvnw clean package
This should result in BUILD SUCCESS. Look at the kubernetes.yml file in the target/kubernetes directory.
Every object (ServiceAccount, Service, Deployment) has a set of annotations and labels. The annotations are picked up automatically when the source directory is under version control (e.g. git) and from the last compile time. The labels are picked up from the parameters specified in the table above. You can specify additional parameters but the Kubernetes extensions uses specific defaults:
app.kubernetes.io/name and name in the YAML are set to quarkus.container-image.name.
app.kubernetes.io/version in the YAML is set to the container-image.tag parameter.
The definition of the port (http, 8080) is picked up by Quarkus from the source code during compile.
Deploy to
With Minikube, we will create the Container (Docker) Image in the Docker installation that is part of the Minikube VM. So after starting Minikube (minikube start) you need to point your local docker command to the Minikube environment:
$ eval $(minikube docker-env)
The Kubernetes extension specifies imagePullPolicy: Always as the default for a container image. This is a problem when using the Minikube Docker environment, it should be never instead. Your application.properites should therefore look like this:
$ kubectl get pod
$ kubectl get deploy
$ kubectl get svc
Note that in the result of the last command you can see the NodePort of the getting-started service, e.g. 31304 or something in that range. Get the IP address of your Minikube cluster:
$ minikube ip
And then test the service, in my example with:
$ curl 192.168.39.131:31304/hello
hello
The result of this execise:
Installing 2 Quarkus extensions and adding 7 statements to the application.properties file (of which 1 is optional) allows you to compile your Java code, build a container image, and deploy it into Kubernetes with a single command. I think this is cool!
What I just described for Minikube also works for the IBM Cloud. IBM Cloud Kubernetes Service (or IKS) does not have an internal Container Image Registry, instead this is a separate service and you may have guessed its name: IBM Cloud Container Registry (ICR). This example works on free IKS clusters, too. A free IKS cluster is free of charge and you can use for 30 days.
For our example to work, you need to create a “Namespace” in an ICR location which is different from a Kubernetes namespace. For example, my test Kubernetes cluster (with the name: mycluster) is located in Houston, so I create a namespace called ‘harald-uebele’ in the registry location Dallas (because it is close to Houston).
Now I need to login and setup the connection using the ibmcloud CLI:
The last command will set the registry region to us-south which is Dallas and has the URL ‘us.icr.io’.
application.properties needs a few changes:
registry now holds the ICR URL (us.icr.io)
group is the registry namespace mentioned above
image-pull-policy is changed to always for ICR
service-account needs to be ‘default’, the service account created by the Kubernetes extension (‘getting-started’) is not allowed to pull images from the ICR image registry
You should see the newly created image, correctly tagged, and hopefully with a ‘security status’ of ‘No issues’. That is the result of a Vulnerability Advisor scan that is automatically performed on every image.
Now check the status of your deployment:
$ kubectl get deploy
$ kubectl get pod
$ kubectl get svc
With kubectl get svc you will see the number of the NodePort of the service, in my example it is 30850. You can obtain the public IP address of an IKS worker node with:
$ ibmcloud ks worker ls --cluster mycluster
If you have multiple worker nodes, any of the public IP addresses will do. Test your service with:
$ curl <externalIP>:<nodePort>/hello
The result should be ‘hello’.
All this also works on
I have tested this with CodeReady Containers (CRC) and on Red Hat OpenShift on IBM Cloud. CRC was a bit flaky, sometimes it would build the image, create the deployment config but wouldn’t start the pod.
On OpenShift, the container image is built using Source-to-Image (s2i) and this requires a different Maven extension:
It seems like you can have only container-image extensions in your project. If you installed the container-image-docker extension before, you’ll need to remove it from the dependency section of the pom.xml file, otherwise the build may fail, later.
There is an OpenShift specific section of parameters / options is the documentation of the extension.
Start with log in to OpenShift and creating a new project (quarkus):
Line 1: Create an OpenShift deployment
Line 2: This is the (OpenShift internal) image repository URL for OpenShift 4
Line 3: The OpenShift project name
Line 4: The image name will also be used for all other OpenShift objects
Line 5: Image tag, will also be the application version in OpenShift
Line 6: Name of the OpenShift application
Line 7: Use the ‘default’ service account
Line 8: Expose the service with a route (URL)
Line 9: Needed for CRC because of self-signed certificates, don’t use with OpenShift on IBM Cloud
With these options in place, start a compile & build:
It will take a while but in the end you should see a “BUILD SUCCESS” and in the OpenShift console you should see an application called “todo-app” with a Deployment Config, Pod, Build, Service, and Route:
Additional and missing options
Namespaces (Kubernetes) and Projects (OpenShift) cannot be specified with an option in application.properties. With OpenShift thats not really an issue because you can specify which project (namespace) to work in with the oc CLI before starting the mvn package. But it would be nice if there were a namespace and/or project option.
The Kubernetes extension is picking up which Port your app is using during build. But if you need to specify an additional port this is how you do it:
This will add an https port on 8443 to the service and an https containerPort on 8443 to the containers spec in the deployment.
The number of replicas is supposed to be defined with:
quarkus.kubernetes.replicas=4
This results in WARN io.qua.config Unrecognized configuration key “quarkus.kubernetes.replicas” was provided; it will be ignored and the replicas count remains 1 in the deployment. Instead use the deprecated configuration option without quarkus. (I am sure this will be fixed):
kubernetes.replicas=4
Adding a key value pair environment variables to the deployment:
My colleague Niklas Heidloff has started to create another version of our Cloud Native Starter using a reactive programming model, and he has also written an extensive series of blogs about it starting here. He uses Minikube to deploy the reactive example and I have created documentation and scripts to deploy it on CloudReady Containers (CRC) which is running Red Hat OpenShift 4.
The reactive version of Cloud Native Starter is based on Quarkus (“Supersonic Subatomic Java”), uses Apache Kafka for messaging, and PostgreSQL for data storage of the articles service. Postgres is accessed via the reactive SQL client. Niklas has blogged about all of the details.
Cloud Native Starter Reactive: High Level Architecture
The deployment on OpenShift is very similar to the deployment of the original Cloud Native Starter which I have written about in my last blog.
The services (web-app, web-api, authors, articles) are build locally in Docker, then tagged with an image path suitable for the OpenShift image repository, then pushed with Docker into the internal repository.
Two things are different, though:
The reactive example currently doesn’t require Istio, no need to install it, then.
Kafka and Postgres weren’t used before.
I install Kafka using the Strimzi operator, and Postgres with the Dev4Devs operator.
In the OpenShift OperatorHub catalog, the Strimzi operator is version 0.14.0, we need version 0.15.0. That’s why I use a script to install the Strimzi Kafka operator and then deploy a Kafka cluster into a kafka namespace/project.
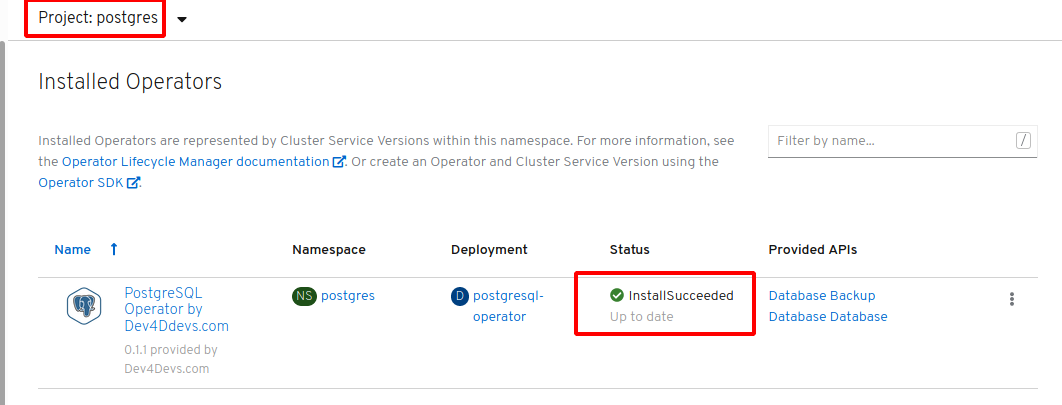
The Dev4Devs Postgres operator is installed through the OperatorHub catalog in the OpenShift web console into its own namespace (postgres).
An example Postgres “cluster” with a single pod is deployed via the operator into the same namespace/project.
Using operators makes it so easy to install components into your architecture. The way they are created in this example is not really applicable to production environments but to create test environments for developers its perfect.
I have written about Cloud Native Starter many times in this blog. It is a project created by Niklas Heidloff, Thomas Südbröcker, and myself that demonstrates how to get started with cloud-native applications and microservice based architectures. We have started it on Minikube, and ported it to IBM Cloud Kubernetes Service and to Red Hat OpenShift in the form of Minishift and Red Hat OpenShift on IBM Cloud, the last two based on OpenShift version 3.
Cloud Native Starter Vue.js frontend
OpenShift 4 on the IBM Cloud is imminent and Minishift has a successor based on version 4 called CodeReady Containers or CRC. Time to move Cloud Native Starter to OpenShift 4. Here is a summary of my experience.
I have blogged about CRC before and back then in September 2019, CRC was version 1.0.0-beta3 and based on OpenShift 4.1.11. Today CRC is version 1.4, and based on OpenShift 4.2.13. It has matured quite a bit. The installation hasn’t changed: CRC is still free of charge, but you need a Red Hat ID (also free) to obtain the pull secrets to install/start it. If you want to use Istio (of course you do!), the minimum requirement of 8 GB memory will not suffice, in my opinion 16 GB of memory are a requirement in this case. Other than that, setting up CRC is done by entering two commands: ‘crc setup’ which checks the prerequisites and does some setup for virtualization and networking, and ‘crc start’ which does the rest. First start takes around 15 minutes. In the end, it will tell you that the cluster is started (hopefully), issue a warning (“The cluster might report a degraded or error state. This is expected since several operators have been disabled to lower the resource usage.”) and give you the credentials to log into OpenShift as kubeadmin and as developer.
Install OpenShift Service Mesh aka Istio
There is a simple way to install Istio — which is called OpenShift Service Mesh by Red Hat — into OpenShift 4. It uses Operators and I already described it in another blog. Service Mesh requires 4 Operators for Elasticsearch, Jaeger, Kiali, and Service Mesh itself. The official documentation still states that you have to install all 4 of them in this sequence. Actually, last time I tried I simply installed the Service Mesh Operator and this pulled the other three without intervention.
While Service Mesh is Istio under the covers, Red Hat has added some features. You can have more than one Istio Control Plane in an OpenShift cluster, and they can have different configurations (demo and production for example). A ‘Member Roll’ then describes which OpenShift projects (namespaces) are a member of a specific Istio Control Plane. With vanilla upstream Istio, a namespace can be tagged to enable ‘automatic sidecar injection’. When a deployment is made to a tagged namespace, an envoy sidecar is then automatically injected into each pod. This is very convenient in Kubernetes but not helpful in OpenShift. Consider constantly doing binary builds: this automatic sidecar injection would inject an envoy into every build pod where it has zero function because this pod will terminate once the build is complete and it doesn’t communicate. Red Hat decided to trigger sidecar injection by adding an annotation to the deployment yaml file:
“Vanilla” Kubernetes/Istio ignores this annotation, there is no problem to have it in yaml files that are used on vanilla Kubernetes/Istio, too.
The telemetry tools and my favorite, Kiali, are integrated into the OpenShift authentication and accessible via a simple OpenShift route (https://kiali-istio-system.apps-crc.testing):
Kiali as part of OpenShift Service Mesh
Access the OpenShift Internal Image Repository
For the CRC/OpenShift 4 port of Cloud Native Starter, I decided to do the container image builds on the local Docker daemon, then tag the resulting image, and push it into the internal image repository of OpenShift. How do you access the internal image repository? You need to login to OpenShift first, the do a ‘docker login’ to the repository:
Problem is that the Docker CLI uses TLS and doesn’t “know” the internal repository. The ‘docker login’ will terminate with a x509 error.
Error response from daemon: Get https://default-route-openshift-image-registry.apps-crc.testing/v2/: x509: certificate signed by unknown authority
CRC uses self signed certificates that Docker doesn’t know about. But you can extract the required certificate and pass it to docker though, I have described the process here.
With the certificate in place for Docker, ‘docker login’ to the OpenShift repository is possible. ‘docker build’ in our scripts is local, the image is then tagged on the local Docker, and in the end push to OpenShift, e.g. for authors-nodejs service:
After that the deployment is standard Kubernetes business with the notable exception that the image name in the deployment YAML file must reflect the location of the image within the OpenShift repository. Of course, our deployment scripts take care of that.
OpenShift and Container Permissions
In Cloud Native Starter there is one service, web-app-vuejs, that provides a Vue.js application, the frontend, to the browser of the user. To do that, Nginx is used as web server. The docker build has two stages: stage 1 builds the Vue.js application with yarn, stage 2 puts the resulting Vue.js into directory /usr/share/nginx/html in the image and Nginx serves this directory at default port 80. Works with vanilla Kubernetes (e.g. Minikube).
The pod reports “CrashLoopBackoff” and never starts in OpenShift. When you look at the logs you’ll notice messages about non-root users and permissions. This image will never run on OpenShift unless you lower security constraints on the project — they were implemented for a reason.
Information on how to solve this problem can be found in the blog Deploy VueJS applications on OpenShift written by Joel Lord:
Start Nginx on a port number above 1024, default port 80 and anything up to 1024 requires root
Move all temporary files (PID, cache, logs, CGI, etc.) to the /tmp directory (can be accessed by everyone
Use /code as base directory
Look here for my modified nginx.conf and Dockerfile.
Result
This is the Cloud Native Starter project in the OpenShift 4 Console: