Logging and Monitoring have always been important but in a distributed microservices architecture on a Kubernetes cluster it is even more important: watching the ever changing components of a cluster is like “guarding a bag of fleas” as the German proverb says. Even our demo “Cloud Native Starter” has at least 4 or 5 pods running that all create logs that at some point when something doesn’t work you need to look at. There are plenty of articles around logging in a Kubernetes cluster with many different solutions. What is important to me as a developer is that I don’t want to care about maintaining it. I need a logging and monitoring solution but I want somebody else to keep it running for me. Fortunately, IBM Cloud is offering that in the form of “IBM Log Analysis with LogDNA” and “IBM Cloud Monitoring with Sysdig”.
Logging and Monitoring are somewhat hidden in the IBM Cloud dashboard. You find them in the “Observabilty” area of the “Burger” menu where you can create the services, learn how to configure the sources, and access their dashboards.

LogDNA can be used with a Kubernetes Cluster running on the IBM Cloud and it can also be used with a Minikube cluster. It is available in the IBM Cloud Datacenters in Dallas and Frankfurt. There is free (lite) version available but this is limited in its features.
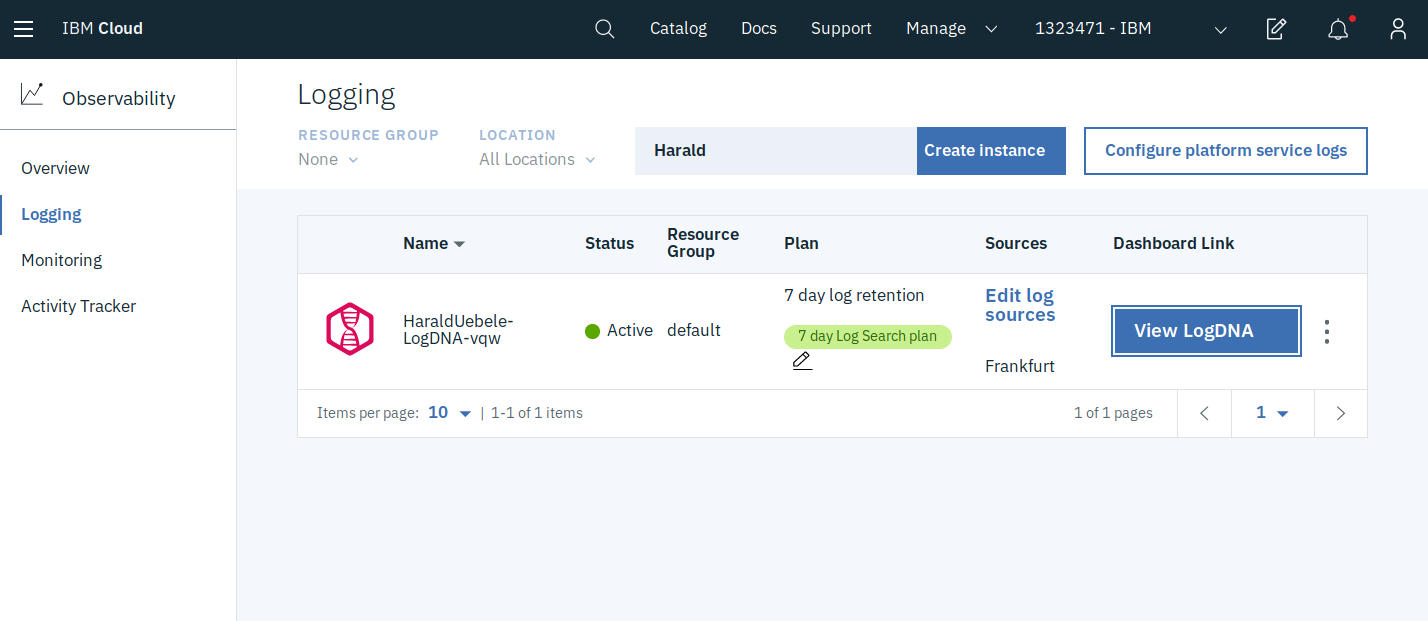
Once a LogDNA instance has been created, the next thing to do is to “Edit log sources”. There are several options, we are only interested in Kubernetes here:

Two kubectl commands need to be executed against the Kubernetes cluster (IBM Kubernetes Service or Minikube work).
The first command creates a Kubernetes secret holding my specific LogDNA ingestion key which is required to write log events into my LogDNA instance. The second command creates a logdna-agent daemon set in the Kubernetes cluster which creates a pod on every Kubernetes worker node. No further installation or configuration is required. If you click on the “View LogDNA” button you’ll see the dashboard:
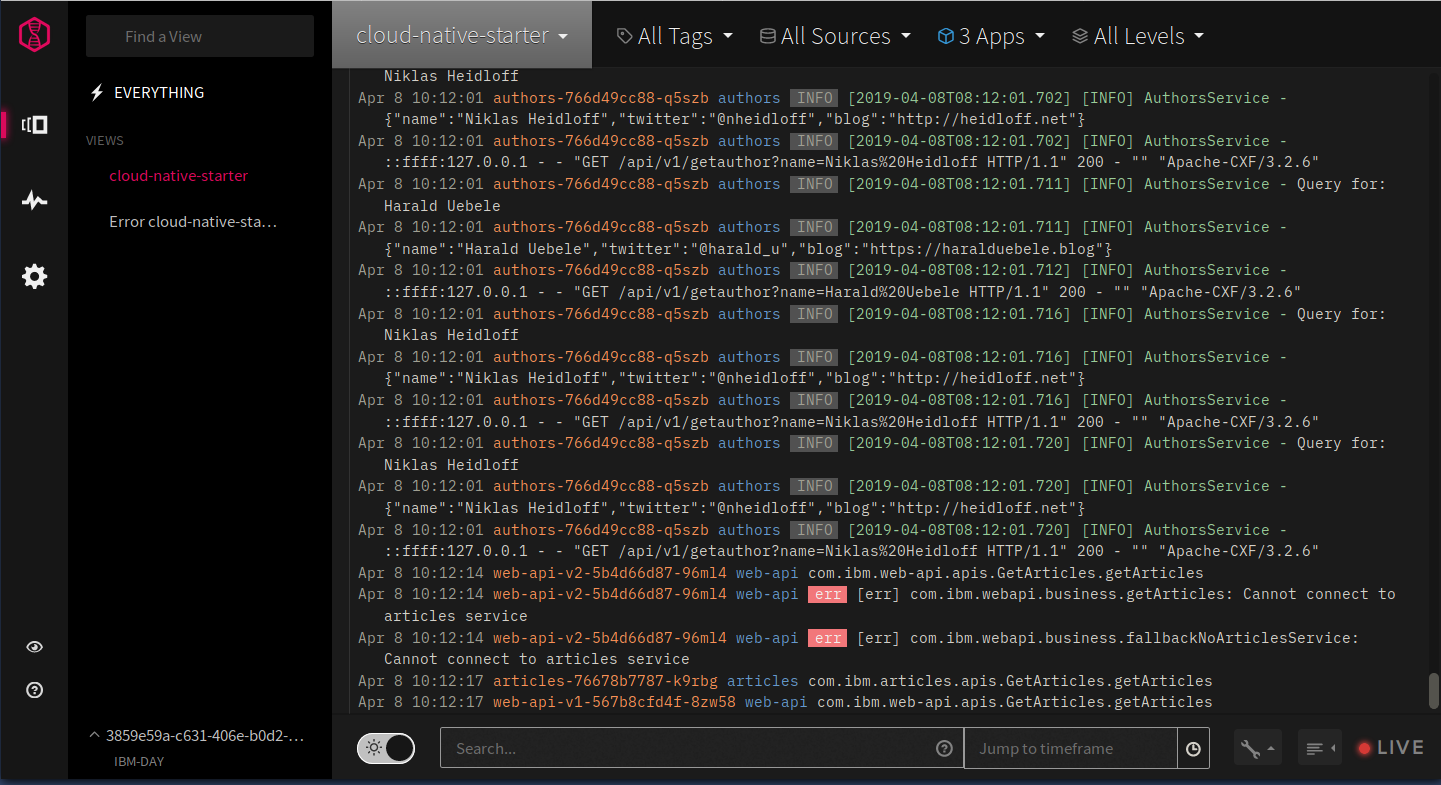
Notice the filters in the header area. In this screenshot I have filtered on 3 Apps, the listing shows “authors”, “web-api”, and “articles”. I can further filter on showing errors only, save that as a view, and attach an alerting channel to it, for example email or a Slack channel. You can find more infos here.

Sysdig can be used with a Kubernetes Cluster running on the IBM Cloud and it can also be used with a Minikube cluster, too. It is available in the IBM Cloud Datacenters in Dallas, London, and Frankfurt. There is trial version available with limited features which expires after 30 days.

Again, once the Sysdig instance has been created, go to “Edit sources”. There are instructions for Kubernetes, Linux, and Docker. The Kubernetes instructions first explain how to logon to the IBM Cloud and then access the Kubernetes cluster with ibmcloud CLI, this is of course not required for Minikube. Lastly there is a curl command that downloads and install the sysdig agent for Kubernetes. Again, there is no further configuration required. The “View Sysdig” button opens the Sysdig dashboard:
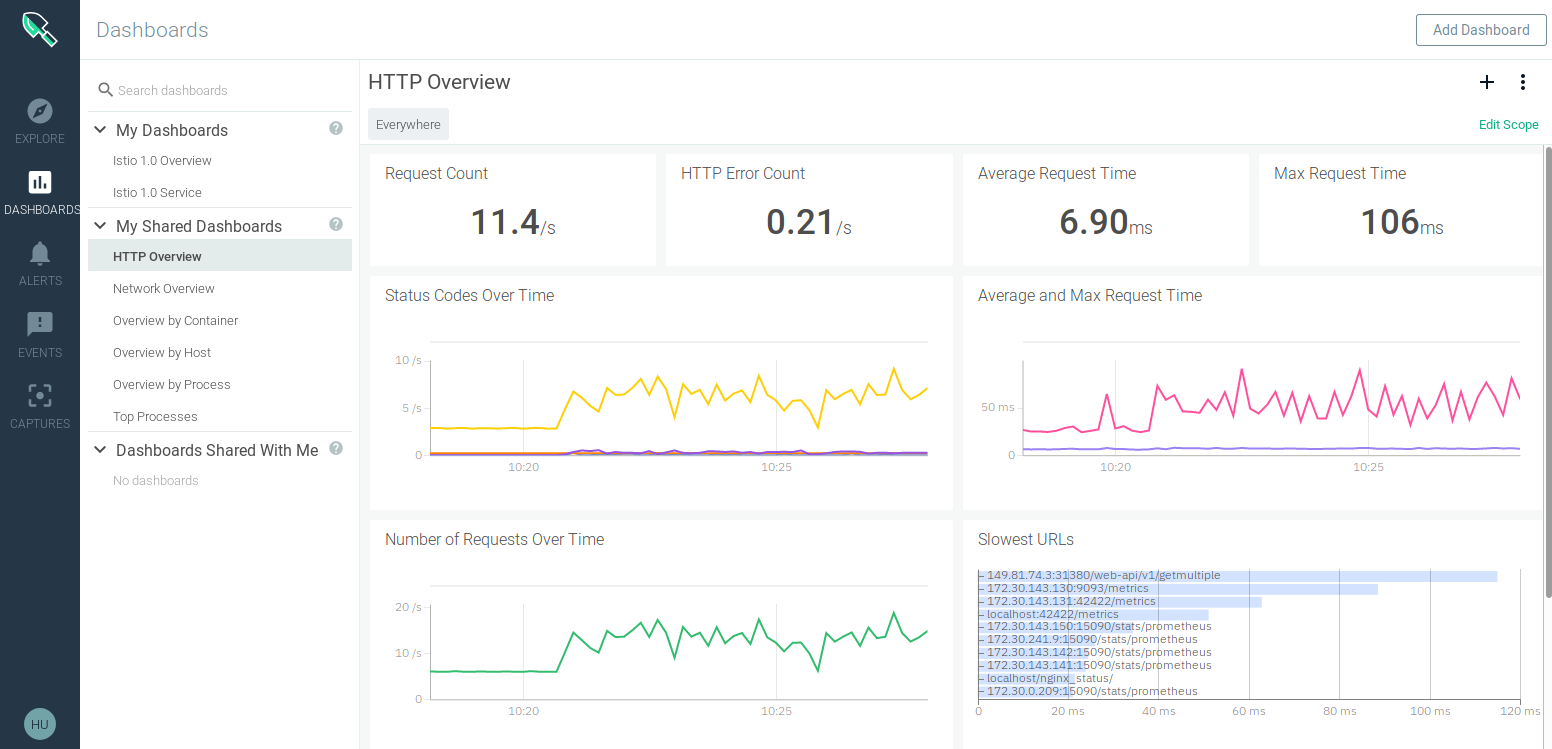
There are several predefined dashboards including 2 predefined Istio dashboards which are not available in the trial version of Sysdig.
One thought on “What’s Going On (in my cluster)?”
Comments are closed.